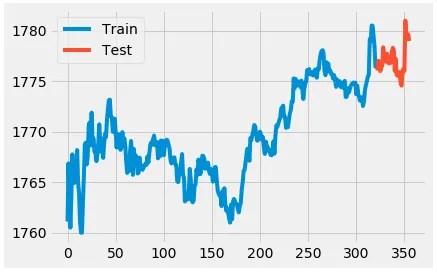
How To Create A Fully Automated AI Based Trading With Python End-to-endproject:get the data,train the model,place the order,get notified.Install $pip install yfinance –userrharper@messtone.com import yfinance as yf google=yf.ticker(“GOOG”) 52WeekChamge:0.3531152 SandP52WeekChange:0.17859101 address1:1600 Amphitheatre Parkway algorithm:None annualHoldingTurnover:None annualReportExpenseRatio:None ask:1815 askSize:1100…twoHundredDayAverage:1553.0764 volume:1320946 volume24Hr:None volumeAllCurrencies:None website:http://www.abc.xyz yeild:None ytdReturn:None zip:94043 The period of the interval is as followsdf=google.history(period='1d',interval="1m")print(df.head( )) df=Google.history(period='1d',interval="1m")print(df.head( ))dividends and stock splits as follows`df=google.history(period=’1d’,interval=”1m”)df=df[[‘Low’]]df.head( )df[‘date’]=pd.to_datetime(df.index).time df.set_index(‘date’,in place=True)df.head( ) keeping the last 10% of the data as the test set: x=df.index.values #The be split point is the 10% of the dataframe length offset=int(0.10*len(df)) X_train=X[:-offset] y_train=y[:-offset] X_test=X[-offset:] y_test=y[-offset:] if we plot it,we get:plt.plot(range(0,len(y_train)),y_train,label=’Train’)plt.plot(range(len(y_train),len(y)),y_test,label=’Test’)plt.legend( )plt.show( )The forecast after the training data ends:from statsmodels.tsa.arima.model import APIMA model=APIMA(y_train,order=(5,0,1).fit( )forecast=model.forecast(steps=1)[0]print(f’Real data for time 0:{y_train[len(y_train)-1]}’)print(f’Real data for time 1:{y_test[0]}’)print(f’Peed data for time 1:{forecast}’) —Real data for time 0:1776.3199462890625 Real data for time 1:1776.4000244140625 Pred data for time 1:1776.392609828666 Robin Stock let’s install it:$pip install robin_stocks

Leave a comment